The project aims to develop predictive models for stock price movements in companies like AMD, Electronic Arts, and Apple, using machine learning techniques. It addresses the challenge of accurately predicting stock prices in dynamic financial markets. Various models such as Linear Regression, Decision Trees, and LSTM networks are employed to capture patterns in financial time series data. The selection of companies from technology and entertainment sectors offers a comprehensive analysis, while inclusion of multiple time frames allows for nuanced performance evaluation.
The primary objectives revolve around predicting stock prices across different time frames and assessing model performance. This includes comparing the accuracy of Linear Regression, Decision Trees, and LSTM models, evaluating their suitability for short-term and long-term predictions. Additionally, feature importance analysis, particularly for Decision Trees, is conducted to identify significant stock features contributing to prediction accuracy. The project seeks to determine the overall best-performing model and time frame for each company and across all companies. Moreover, variability analysis is performed to understand the robustness and consistency of each model under varying market conditions.
The dataset utilized in this project was obtained through the yfinance library, facilitating the download of stock data for AMD, Electronic Arts, and Apple. These individual datasets were merged into a unified DataFrame to enable comparative analyses and predictions. Spanning from January 2, 2001, to November 29, 2023, the dataset offers a comprehensive exploration of historical stock price data for over two decades. Each entry corresponds to a specific date, creating a time-series structure capturing day-to-day fluctuations in stock prices.
The dataset includes several key columns:
Open: Opening price of the stock at the beginning of a trading day.
High: Highest price reached by the stock during the trading day.
Low: Lowest price recorded by the stock in the course of the trading day.
Close: Closing price of the stock at the end of the trading day.
Adj_Close: Adjusted closing price, considering actions like dividends and stock splits.
Volume: Total number of shares traded on a given day.
company_name: Identifies the specific company to which the stock data belongs.

The project's design focuses on predicting stock prices using a multifaceted approach, integrating diverse techniques to address the challenge. The motivation behind the project is to explore and compare the effectiveness of traditional statistical methods, like Linear Regression, against more complex machine learning models, such as Decision Trees, and deep learning techniques, like LSTM networks. The project begins with a detailed examination of historical stock data, concentrating on key variables like Open, High, Low, and Volume, which serve as the foundation for training and testing the predictive models. Using multiple models provides a comprehensive understanding of their strengths and limitations in capturing the intricate patterns inherent in stock price movements.
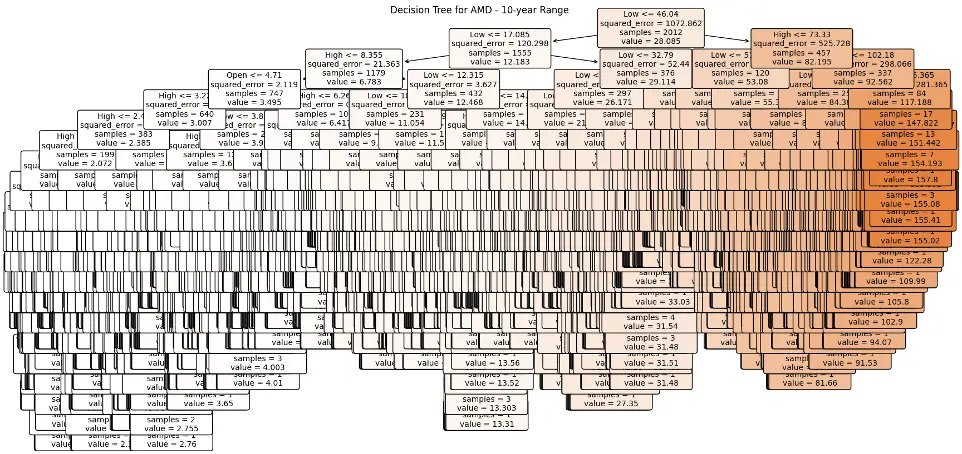
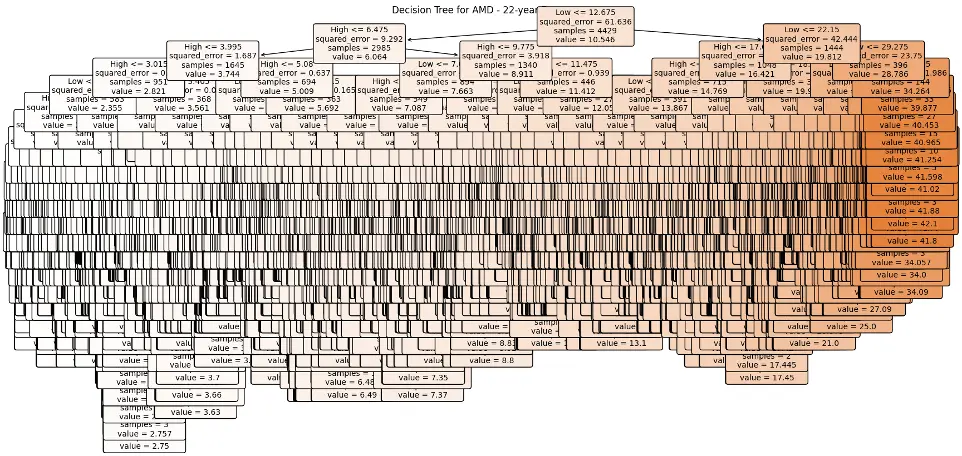
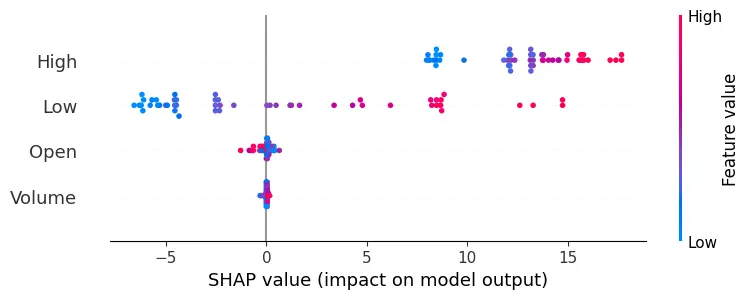
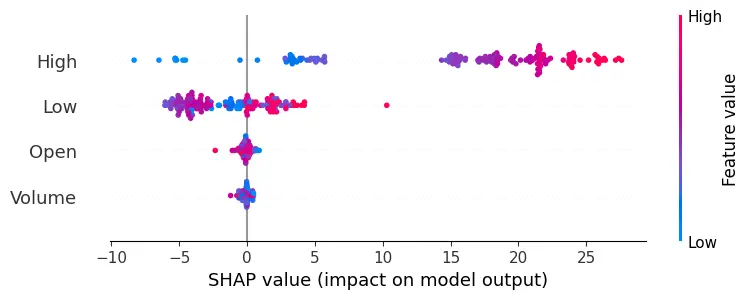
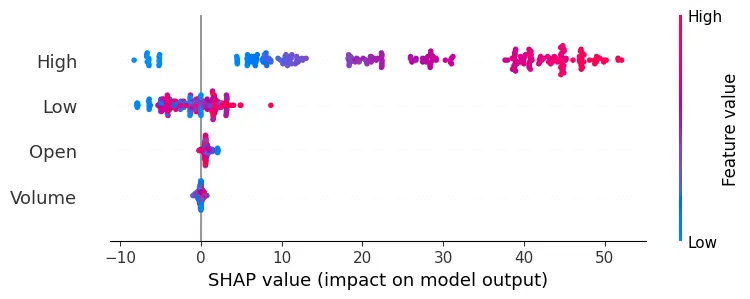
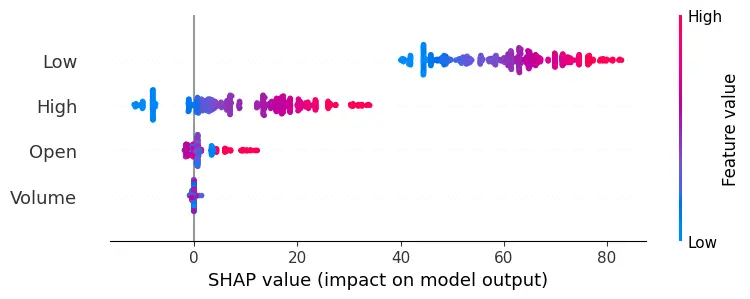
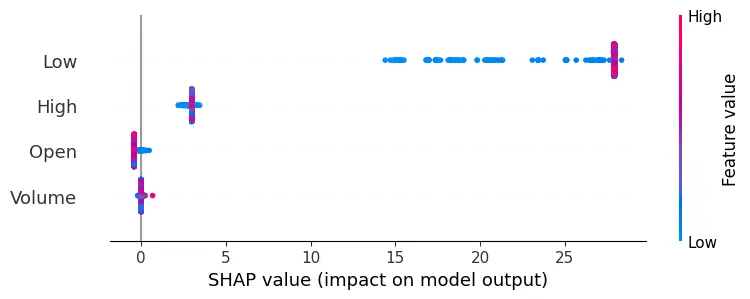
The methodology combines traditional statistical methods with advanced machine learning and deep learning techniques. It begins with Linear Regression, a fundamental tool that leverages historical price trends to establish a baseline for predicting stock prices, assuming a linear relationship between predictor variables and stock closing prices. The Decision Trees model adds complexity, chosen for its interpretability and ability to capture non-linear relationships within the data. Implementing the Decision Tree Regressor involves using SHAP (SHapley Additive exPlanations) values, a cutting-edge technique that enhances model interpretability by revealing feature importance, providing deeper insights into how specific factors influence stock price predictions.
The methodology then explores deep learning through Long Short-Term Memory (LSTM) networks. Unlike traditional models, LSTM networks excel at capturing temporal dependencies in sequential data, making them particularly suited for time-series forecasting. This involves data preprocessing, including scaling and reshaping to meet the input requirements of the LSTM model. The preprocessing steps include splitting the data into training and testing sets, ensuring the models are evaluated on unseen data to gauge their real-world predictive capabilities.
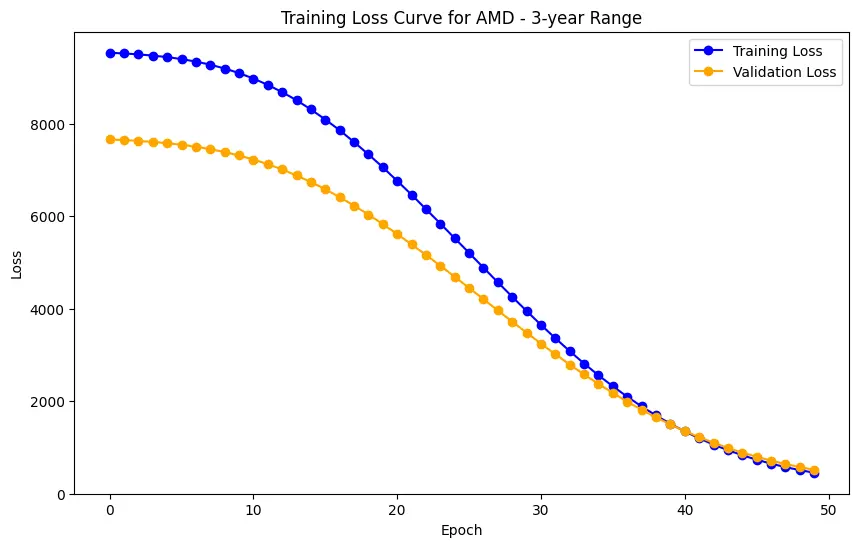
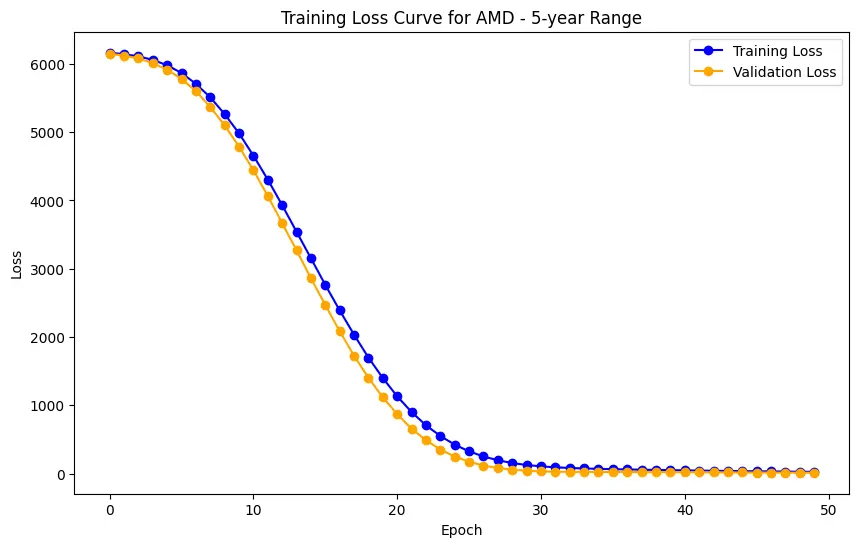
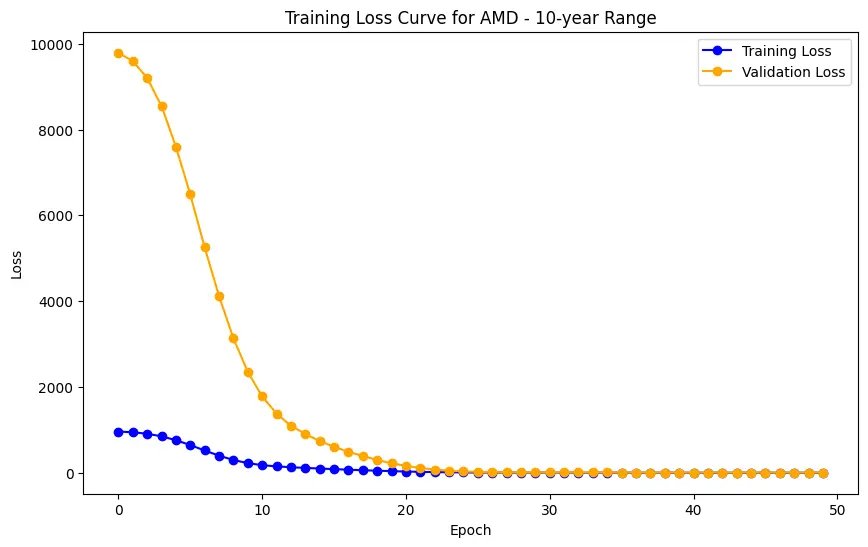
Model training is tailored to specific time ranges (1, 3, 5, 10 years, and full range) designated for evaluation. Each model is trained with its unique algorithm, adapting to the temporal nuances and patterns within the data. The Decision Trees model stands out with its insightful feature importance analysis, driven by SHAP values. This comprehensive methodology not only delves into the technical intricacies of model training but also highlights the importance of interpretability, a crucial factor in making informed decisions based on predictive analytics in financial markets.
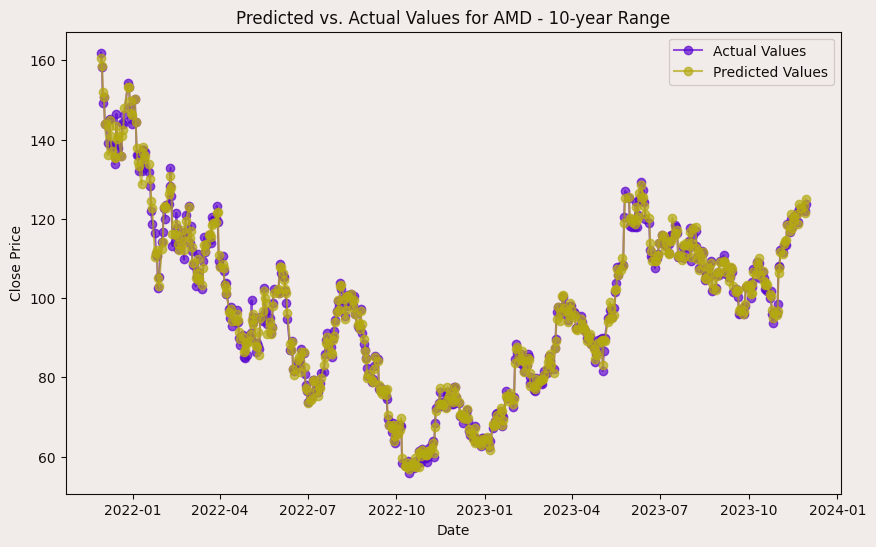
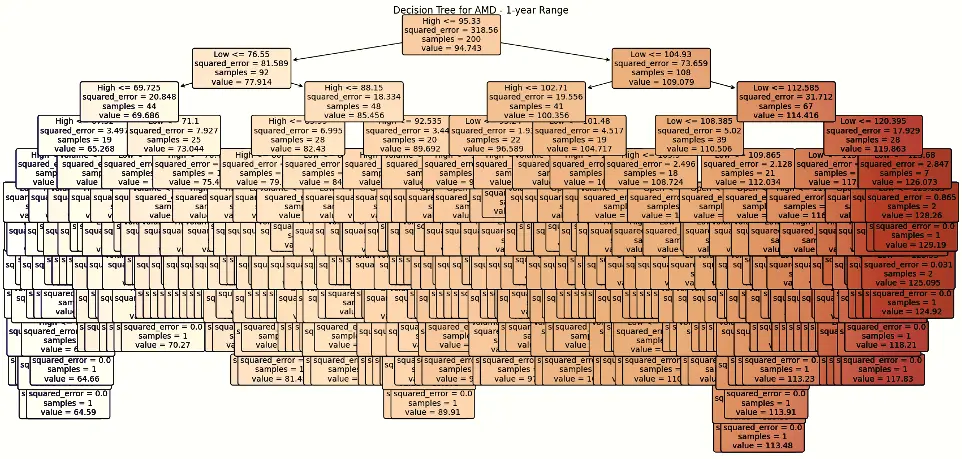
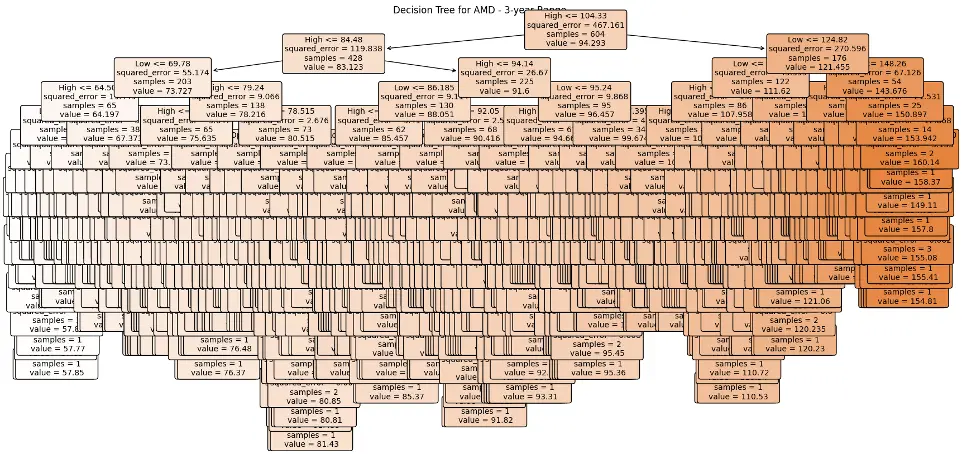
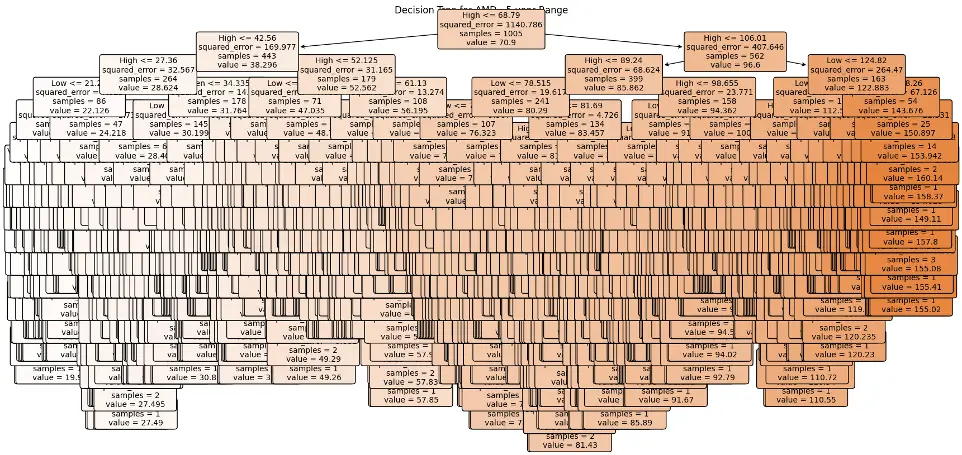
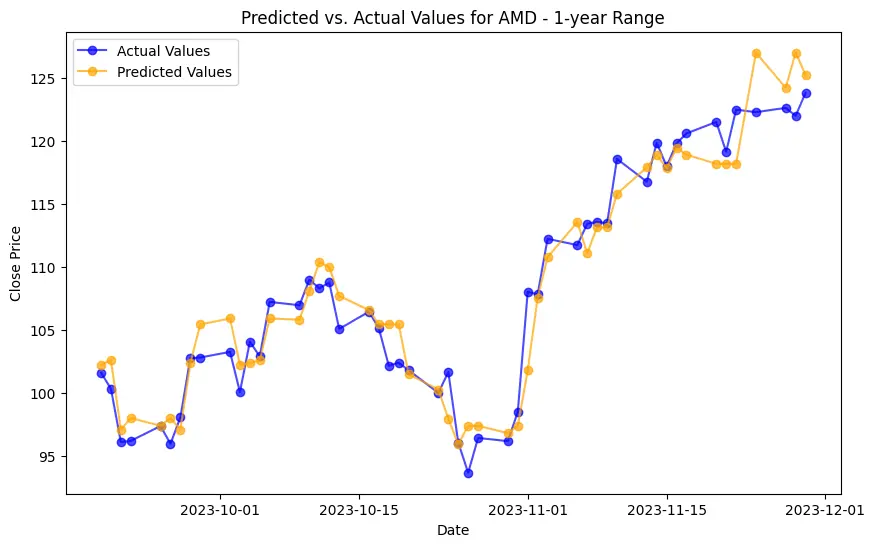
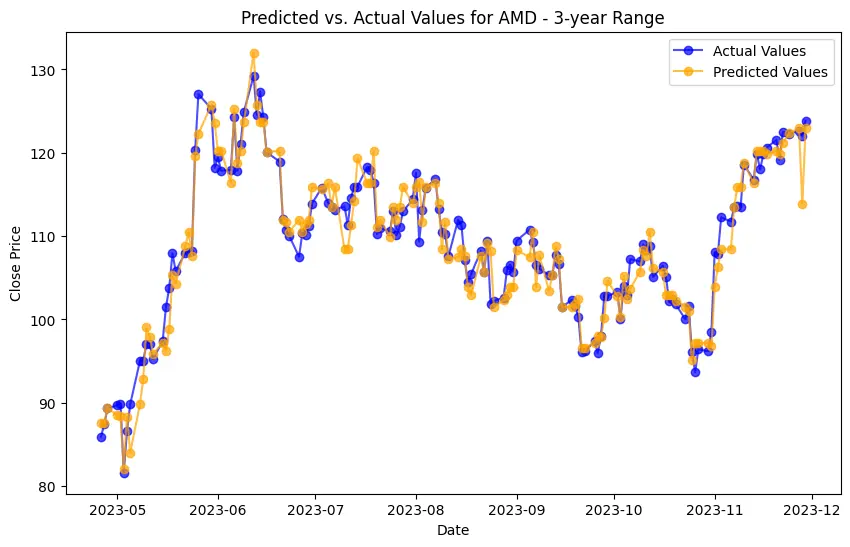
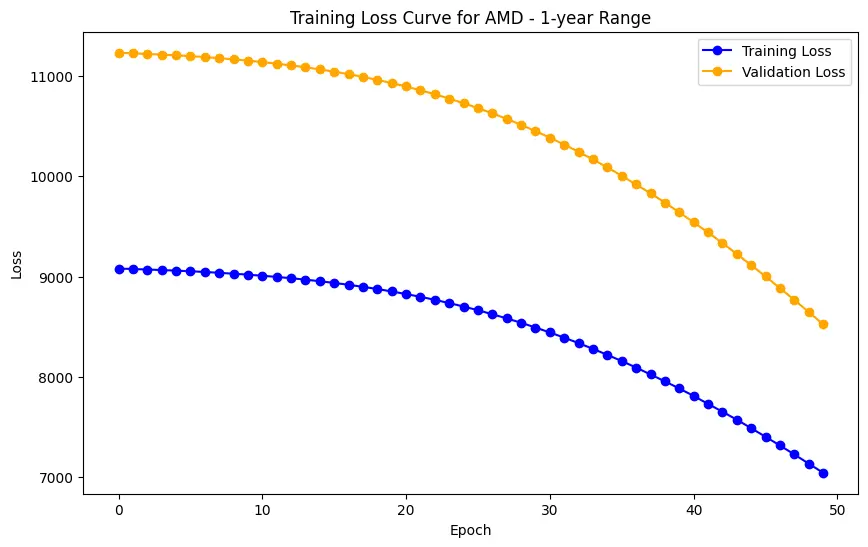
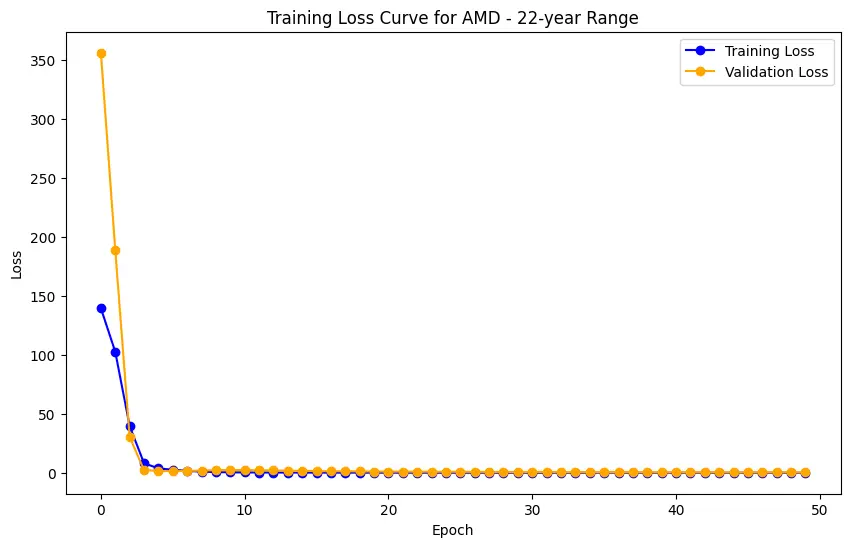
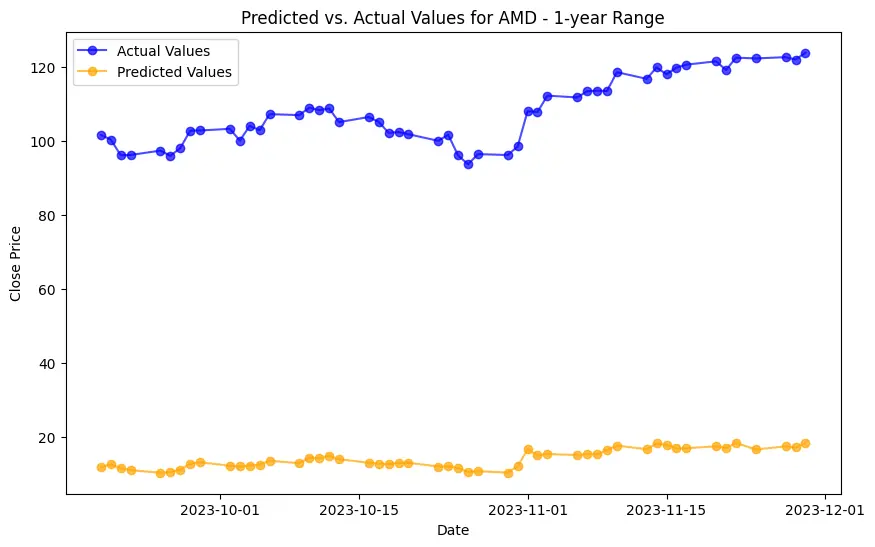
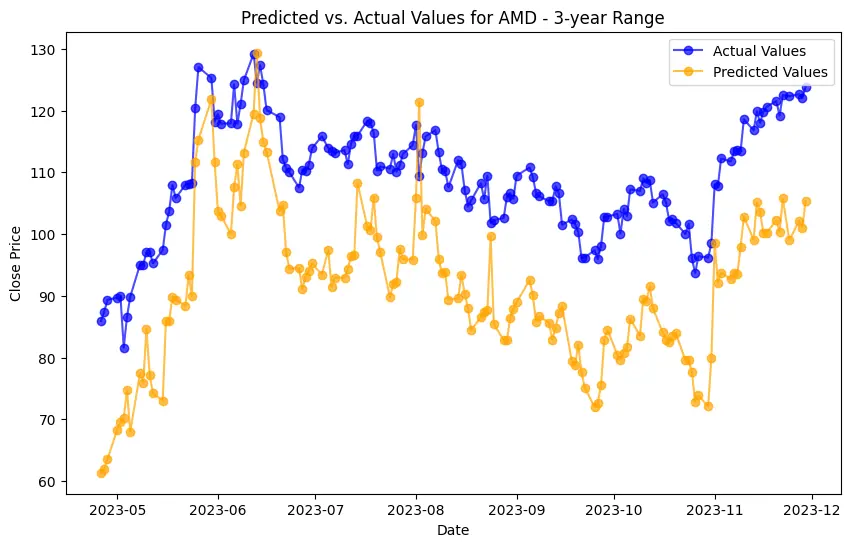
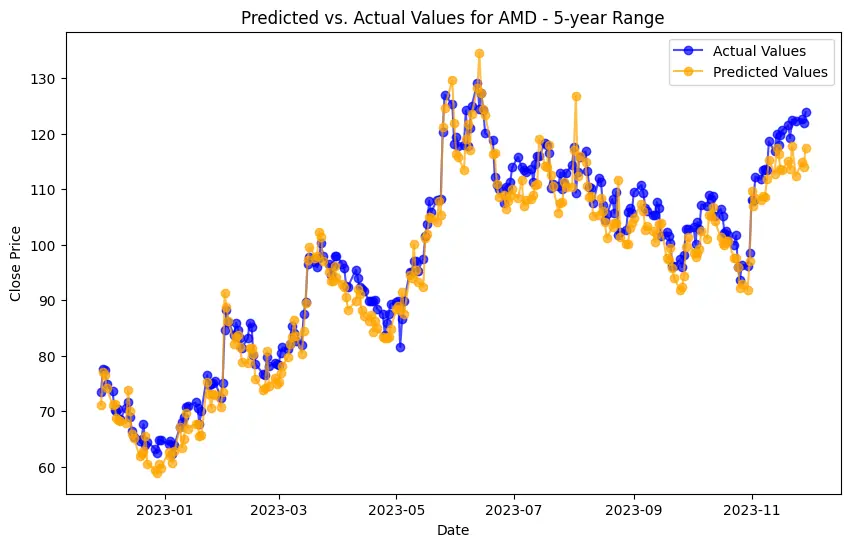
Implementation begins with data preprocessing, model training, and concludes with model evaluation. For the LSTM model, this involves an additional layer of complexity with data scaling and reshaping to meet the network's input requirements. Generated plots play a pivotal role in understanding the models' behavior, depicting the training loss curve for LSTM, and visually comparing predicted versus actual stock prices. Key implementations include the Decision Trees model's feature importance analysis and visualization of its structure. SHAP values help understand the impact of different features on predictions, adding depth to the model’s interpretability.
The evaluation phase rigorously tests and compares the project's models. Performance metrics, ranging from Mean Squared Error to R2 Score, provide quantitative insights into the efficacy of each model. Experiments conducted across different time ranges offer a nuanced understanding of model performance under varying forecasting horizons. Comparative analyses highlight the unique contributions of each technique, extending the evaluation beyond a singular metric to a comprehensive view of models' performance from multiple angles. The project's strength lies not only in predicting stock prices but also in discerning the most suitable model for diverse scenarios, contributing to the broader discourse on predictive analytics in financial markets.
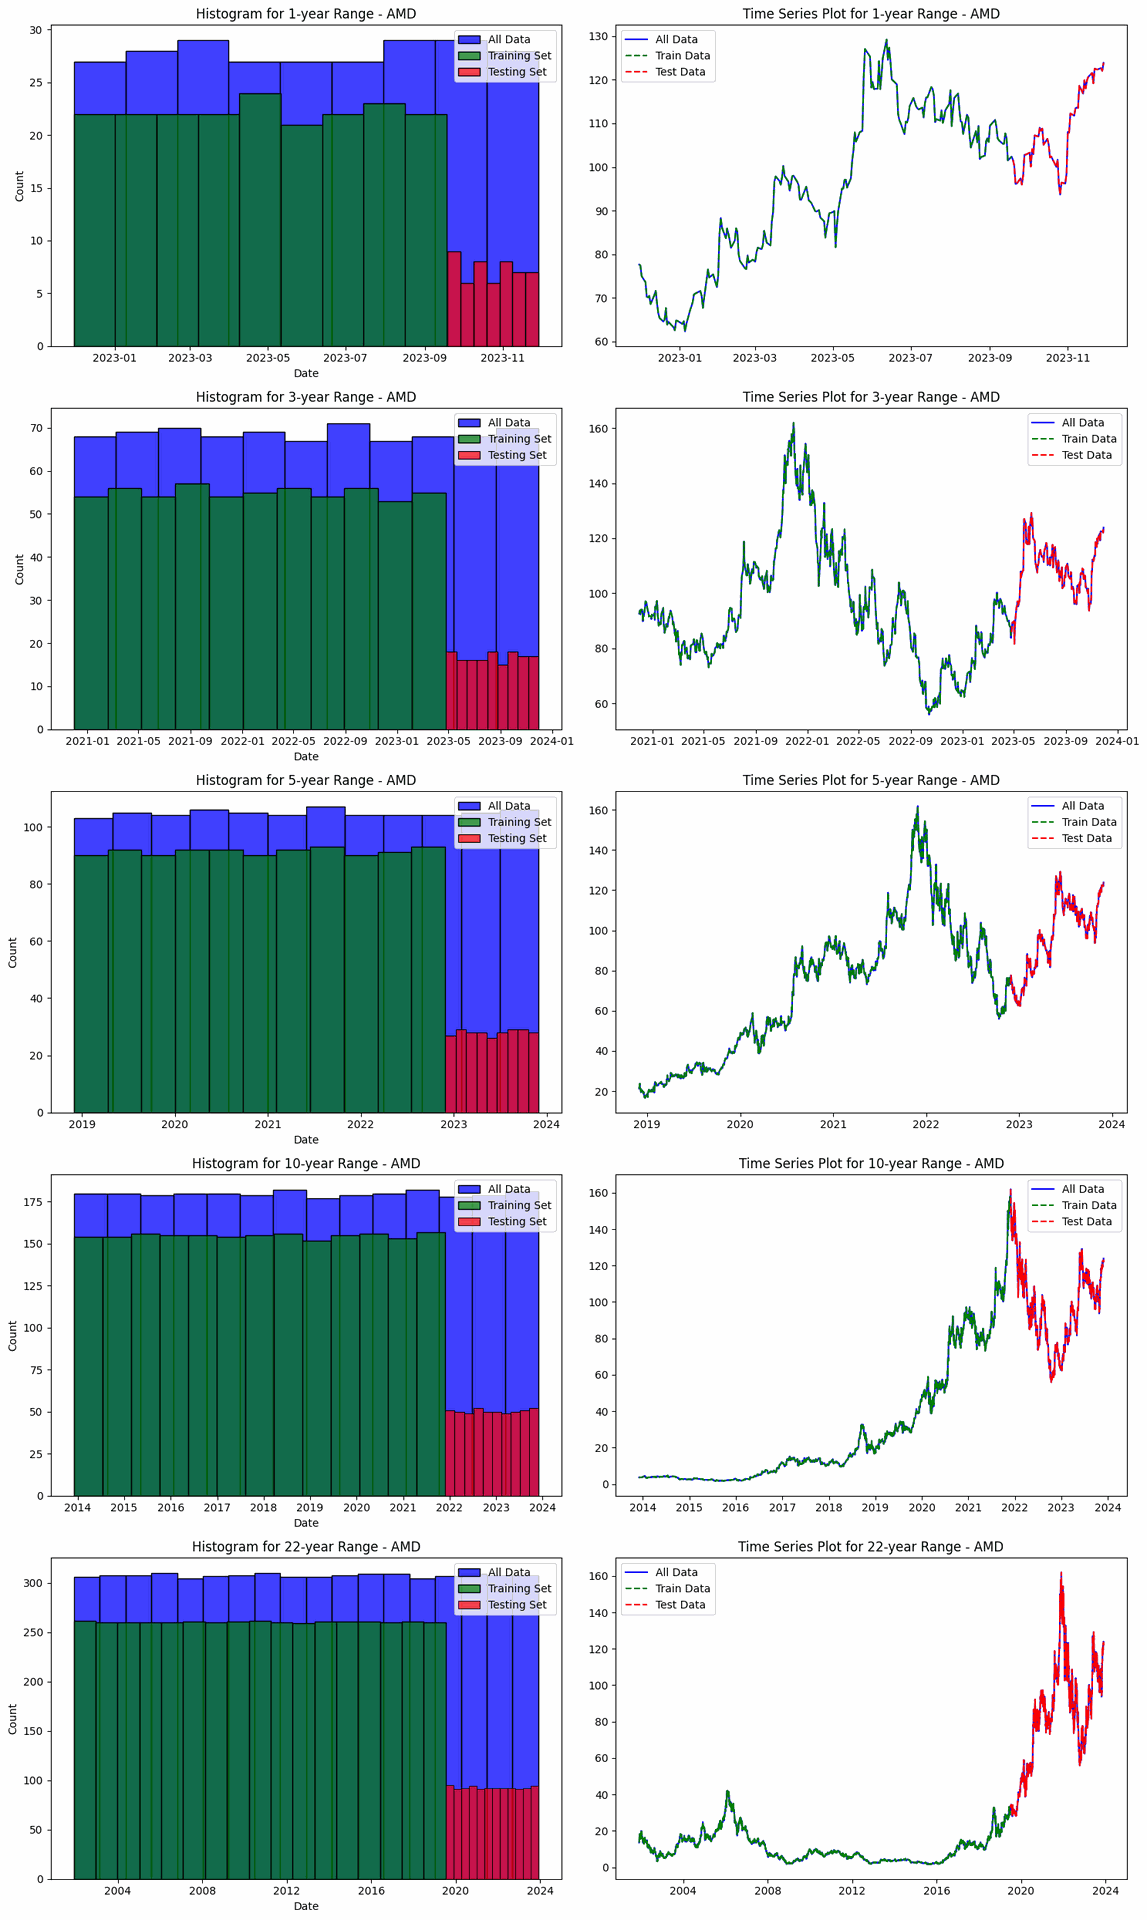
The project involves predicting stock prices for AMD, Electronic Arts, and Apple over various time ranges: 1-year, 3-year, 5-year, 10-year, and 22-year. For each company and time range, data is split into training and testing sets. For AMD, the data ranges from 200 training and 51 testing entries for 1-year (2022-11-30 to 2023-11-29) to 4429 training and 1108 testing entries for 22-year (2001-11-30 to 2023-11-29). The same splits apply to Electronic Arts and Apple, with identical training and testing sizes and date ranges. This structure enables a thorough evaluation of model performance across different forecasting horizons.
Displayed evaluations are only for "AMD", checkout full Documentation here Link..

SHAP values measure how much each feature, or "player", contributes to the model's output.
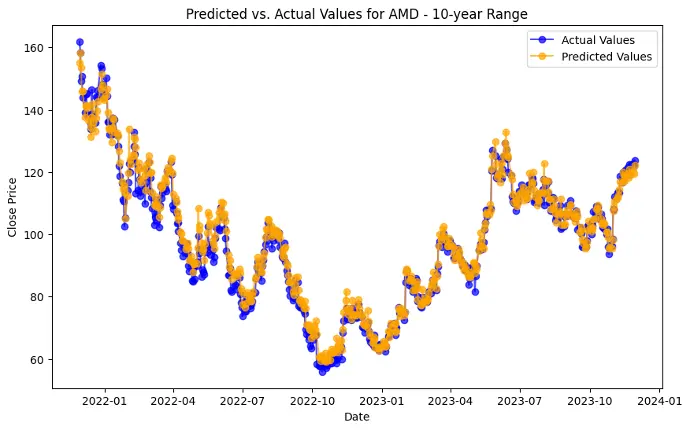
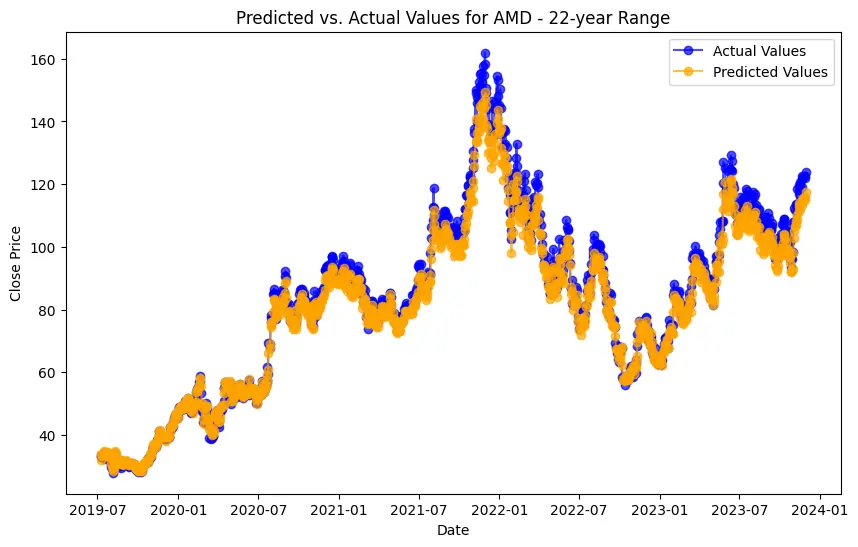
The evaluation results for various machine learning models applied to different time ranges of stock data for three companies—AMD, Electronic Arts, and Apple—reveal intriguing insights into the predictive performance of these models.
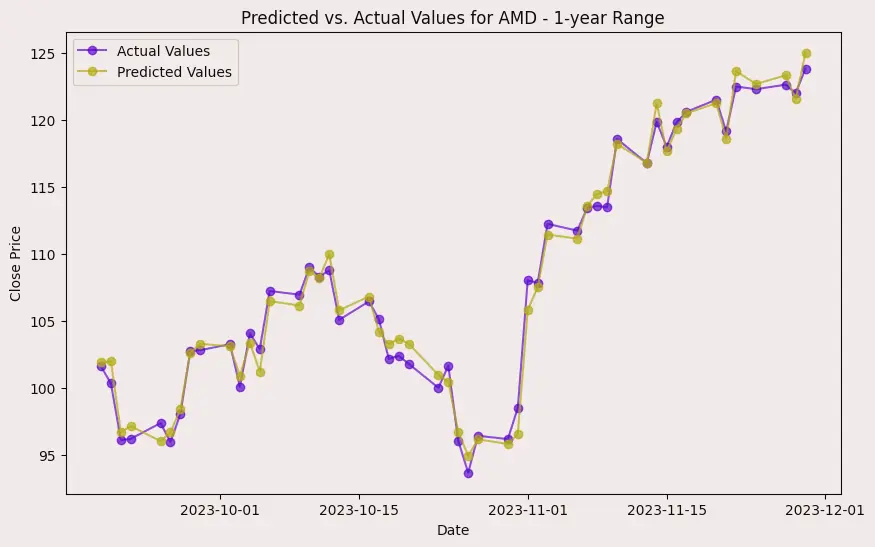
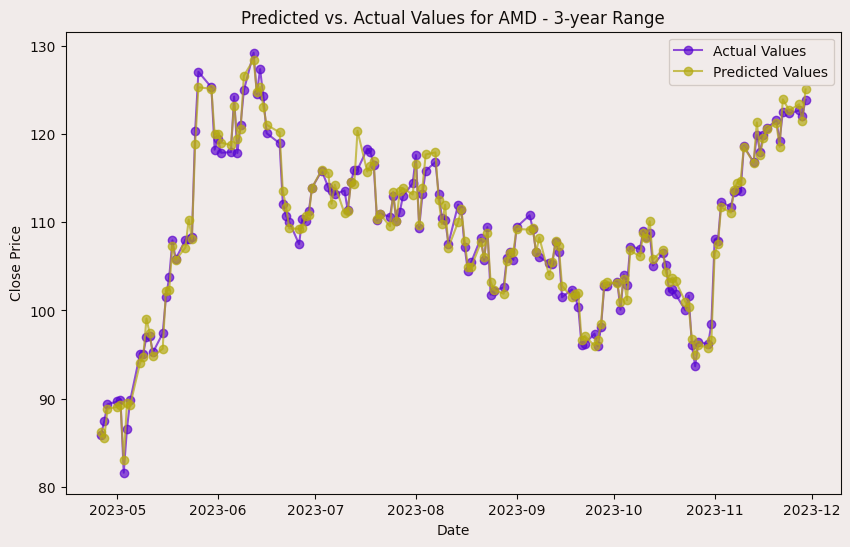
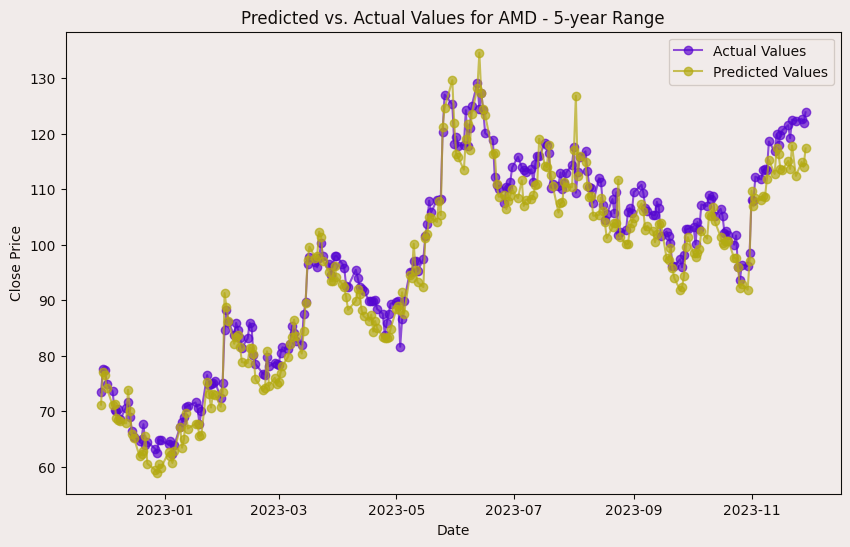
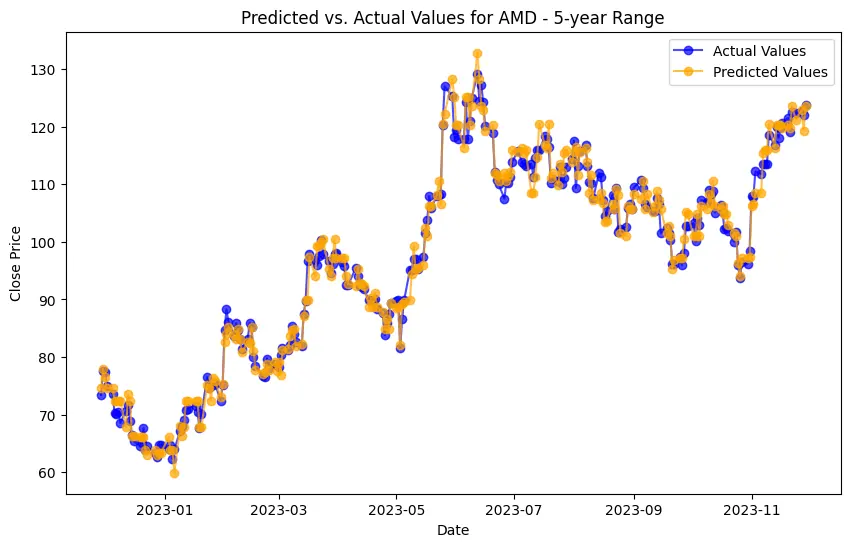
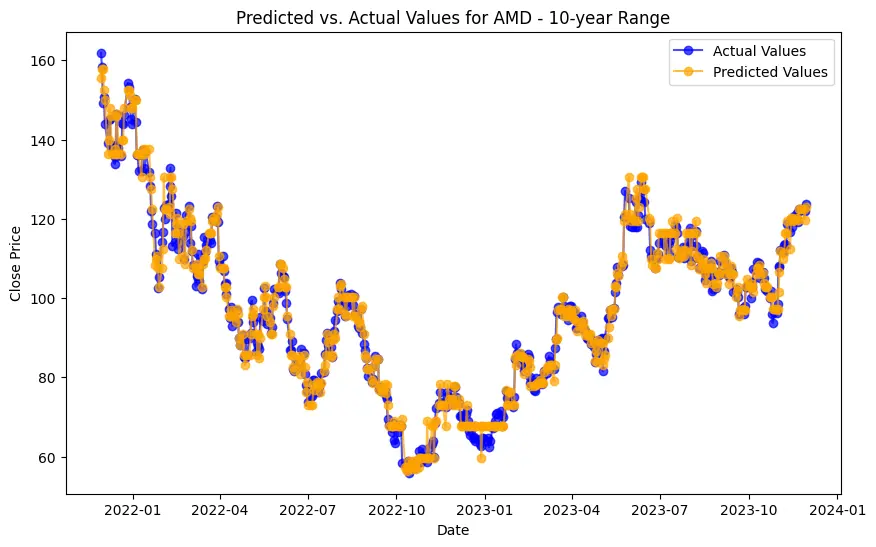
In the case of AMD, the accuracy of predictions varied significantly depending on the time range and the model used. For the 1-year range, the linear regression model demonstrated excellent performance, with a Mean Squared Error (MSE) of 0.0052, Mean Absolute Error (MAE) of 0.0504, Root Mean Squared Error (RMSE) of 0.0722, and an R2 score of 84.29%, indicating a strong correlation between predicted and actual values. However, the LSTM model performed poorly, showing a significantly higher MSE of 0.2823 and RMSE of 0.5314, along with a negative R2 score of -7.13%, indicating a poor fit. Similar trends were observed across different time ranges, highlighting the sensitivity of the models to the time horizon of the data.
For Electronic Arts, a similar pattern emerged, with the linear regression model consistently outperforming the other models across different time ranges. Again, the LSTM model struggled to provide accurate predictions, especially for shorter time ranges, as indicated by the high MSE, MAE, and RMSE values (e.g., MSE of 0.0116 for the 1-year range) and negative R2 scores. This suggests that the complex temporal dependencies in the data may not be adequately captured by the LSTM model within the given time frames.
Apple's stock data presented similar challenges for prediction, with the linear regression model generally achieving better accuracy compared to decision trees and LSTM models. Particularly noteworthy is the poor performance of the LSTM model, which yielded very high MSE (e.g., 0.0139 for the 1-year range) and RMSE values and negative R2 scores across different time ranges. This suggests that the LSTM model may not be suitable for capturing the underlying patterns in Apple's stock data effectively.
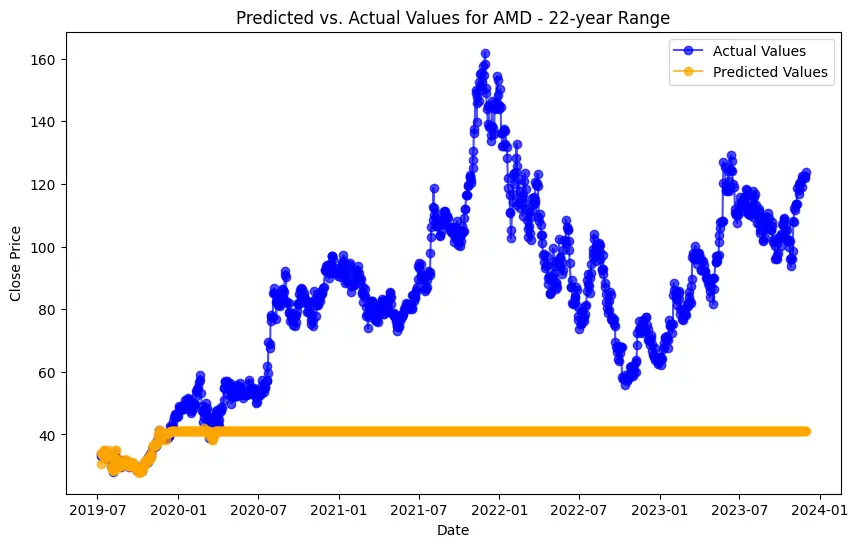
Across all companies and time ranges, the linear regression model consistently demonstrated superior predictive performance compared to decision trees and LSTM models. This indicates that for the given datasets and time frames, the linear regression model's simplicity and interpretability outweigh the complexity of more sophisticated models like decision trees and LSTMs. Additionally, the poor performance of the LSTM model suggests that the temporal dependencies in the data may not be adequately captured by the architecture used in this study, highlighting the importance of selecting appropriate models for time series prediction tasks.